Several tools are available for creating diagrams from textual descriptions. One particularly useful option is kroki.io, which provides an API for rendering multiple diagram formats. It's highly recommended to explore the Cheat Sheet to get an overview of the supported syntaxes.
In the past, I’ve primarily used GraphViz and Mermaid for building network topologies. More recently, I’ve started working with D2, a newer open-source tool that uses a modern domain-specific language (DSL) for diagram creation.
This post demonstrates how to use D2 to build network topologies and highlights some of the key features it offers.
The NetAutLab Topology with NAPALM includes a task to create a network topology using data collected with NAPALM. After reading this post, you should be well-equipped to complete the task using D2. When generating diagrams from textual descriptions, keep the following guidelines in mind:
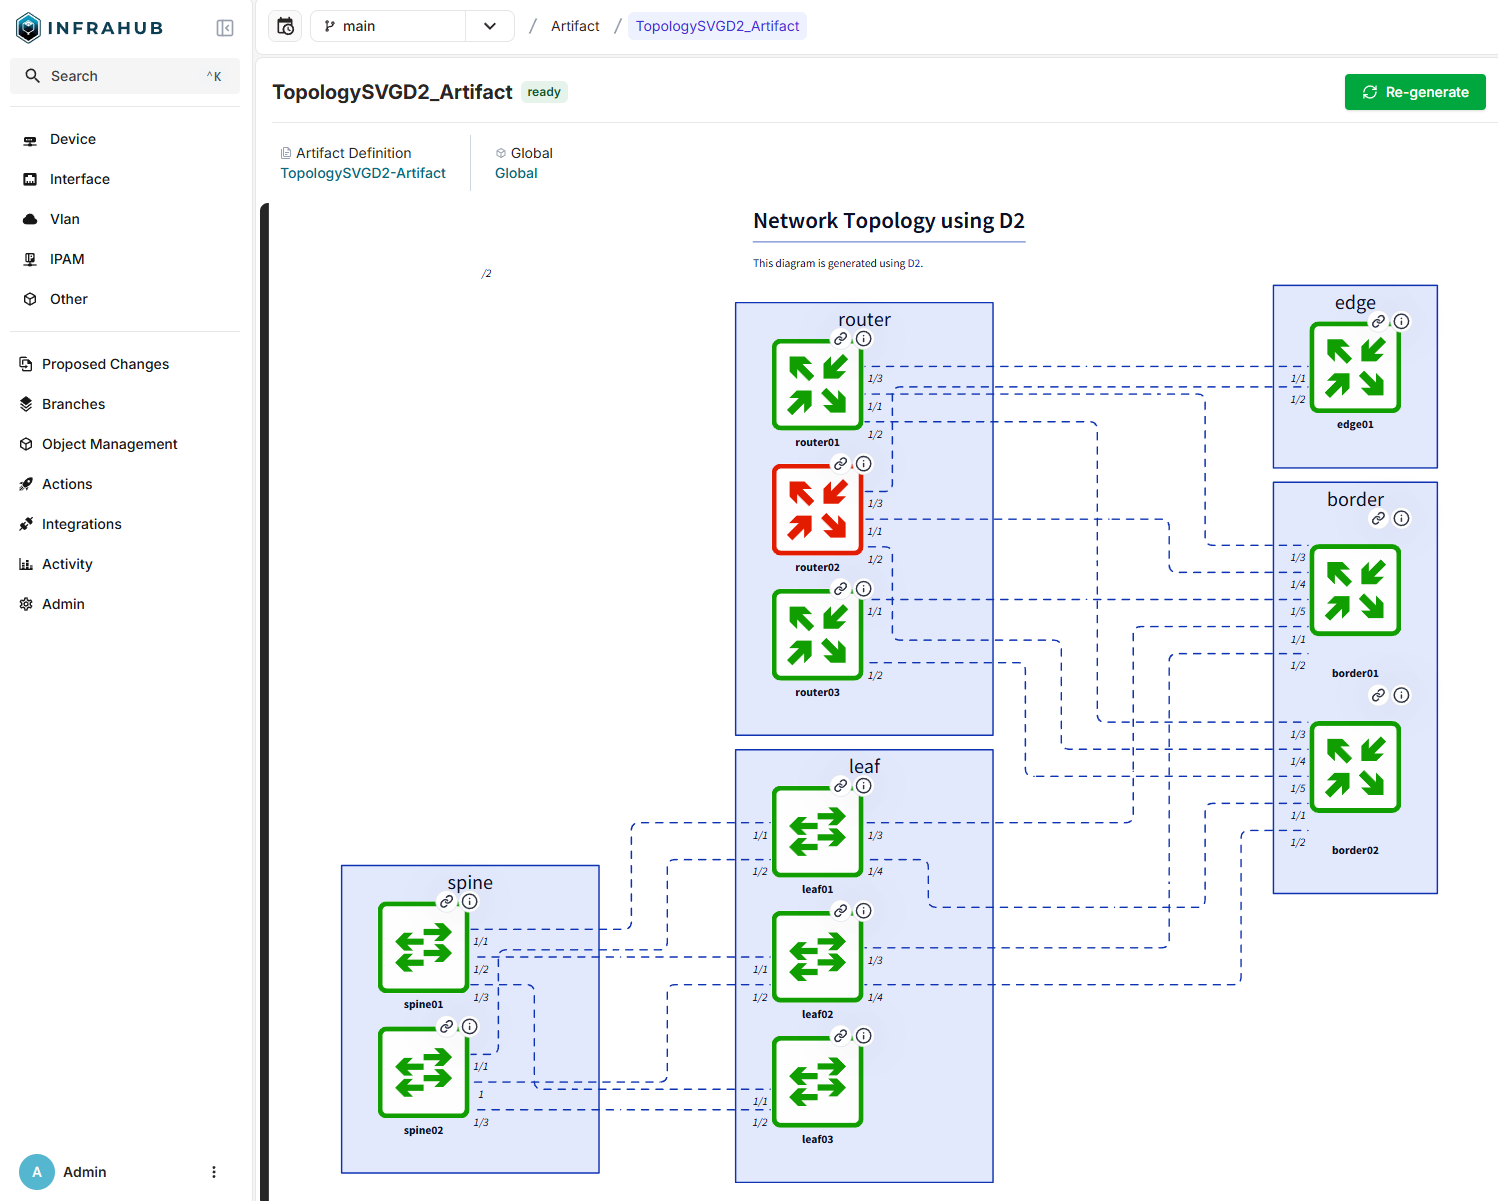
The generated SVG can be used in various ways, such as embedding it directly in your documentation. The image below shows an example of rendering the diagram as an artifact within Infrahub. This approach ensures that the diagram remains up to date.
The command %load_ext kroki kroki enables the Jupyter Notebook magic function %%kroki, which allows you to render diagrams using the Kroki API and receive the output as SVG. At the end of this post, you'll find examples showing how to interact with the API directly using Python.
To provide a simple comparison, the following examples generate a 3-leaf, 2-spine CLOS network topology using GraphViz, Mermaid, and D2. These examples are intentionally basic, with no fine-tuning, to highlight the core syntax of each tool.
Thanks to Josh "Jay" Stewart for pointing me to text-to-diagram, a webpage for comparing the text to diagram tools online.
%load_ext kroki
%%kroki graphviz

graph {
    node [shape=box, style="rounded,filled"]
    spine01 -- leaf01
    spine01 -- leaf02
    spine01 -- leaf03
    spine02 -- leaf01
    spine02 -- leaf02
    spine02 -- leaf03
}
%%kroki mermaid

graph TB;
    spine01 --- leaf01;
    spine01 --- leaf02;
    spine01 --- leaf03;
    spine02 --- leaf01;
    spine02 --- leaf02;
    spine02 --- leaf03;
%%kroki d2

spine01 -- leaf01
spine01 -- leaf02
spine01 -- leaf03
spine02 -- leaf01
spine02 -- leaf02
spine02 -- leaf03
Especially in large networks, diagramming tools can struggle to arrange nodes in a way that appears clear and intuitive to a network engineer. Grouping devices can significantly improve readability. Devices may be grouped by role, location, or any other logical structure that fits the network design.
Nested grouping is also supported. In D2, this can be achieved using dot notation (as shown in the example below) or curly brackets for a more structured and readable layout. This feature is referred to as containers.
%%kroki d2

spine.spine01 -- leaf.siteA.leaf01
spine.spine01 -- leaf.siteA.leaf02
spine.spine01 -- leaf.siteB.leaf03
spine.spine02 -- leaf.siteA.leaf01
spine.spine02 -- leaf.siteA.leaf02
spine.spine02 -- leaf.siteB.leaf03
Labels can be applied to containers, nodes, and links. However, they should be used sparingly, as they can clutter the diagram.
%%kroki d2

leaf: {
  siteA: Site A
}
leaf.siteB: Site B

spine.spine01 -- leaf.siteA.leaf01: Uplink
spine.spine01 -- leaf.siteA.leaf02: Uplink
spine.spine01 -- leaf.siteB.leaf03: Uplink
spine.spine02 -- leaf.siteA.leaf01: Uplink
spine.spine02 -- leaf.siteA.leaf02: Uplink
spine.spine02 -- leaf.siteB.leaf03: Uplink
Node properties, such as shape, can be set using either dot notation or curly bracket syntax.
%%kroki d2

leaf: {
  siteA: Site A {
    leaf01: {
      shape: oval
    }
    leaf02.shape: circle
  }
  siteB: Site B
}
leaf.siteB.leaf03.shape: hexagon
spine.spine01.shape: cloud
spine.spine02.shape: person

spine.spine01 -- leaf.siteA.leaf01
spine.spine01 -- leaf.siteA.leaf02
spine.spine01 -- leaf.siteB.leaf03
spine.spine02 -- leaf.siteA.leaf01
spine.spine02 -- leaf.siteA.leaf02
spine.spine02 -- leaf.siteB.leaf03
In D2, you can assign icons to nodes to enhance visual clarity and convey additional meaning. This is especially useful for distinguishing between different device types or roles in a network diagram. Icons should be in SVG format. By setting the shape property to image, the icon is displayed without a surrounding box, resulting in a cleaner, standalone appearance.
%%kroki d2

spine.spine01: {
  icon: https://svg.infrastructureascode.ch/square/green/sq_switch.svg
}
spine.spine02: {
  shape: image
  icon: https://svg.infrastructureascode.ch/square/green/sq_switch.svg
}

spine.spine01 -- leaf.siteA.leaf01
spine.spine01 -- leaf.siteA.leaf02
spine.spine01 -- leaf.siteB.leaf03
spine.spine02 -- leaf.siteA.leaf01
spine.spine02 -- leaf.siteA.leaf02
spine.spine02 -- leaf.siteB.leaf03
%%kroki d2

classes: {
  switch_green: {
    shape: image
    icon: https://svg.infrastructureascode.ch/square/green/sq_switch.svg
  }
}

spine.spine01.class: switch_green
spine.spine02.class: switch_green
leaf.siteA.leaf01.class: switch_green
leaf.siteA.leaf02.class: switch_green
leaf.siteB.leaf03.class: switch_green

spine.spine01 -- leaf.siteA.leaf01
spine.spine01 -- leaf.siteA.leaf02
spine.spine01 -- leaf.siteB.leaf03
spine.spine02 -- leaf.siteA.leaf01
spine.spine02 -- leaf.siteA.leaf02
spine.spine02 -- leaf.siteB.leaf03
When enriching a topology with additional information, it's important to avoid cluttering the diagram. Overloaded diagrams are hard to read and visually unappealing. SVGs support interactive elements such as Hyperlinks and Tooltips, which are excellent ways to add context without overcrowding the topology.
%%kroki d2

spine.spine01: {
  tooltip: mgmt ip: 10.10.10.11\nplatform: eos
  link: https://infrastructureascode.ch/
}


spine.spine01 -- leaf.siteA.leaf01
spine.spine01 -- leaf.siteA.leaf02
spine.spine01 -- leaf.siteB.leaf03
spine.spine02 -- leaf.siteA.leaf01
spine.spine02 -- leaf.siteA.leaf02
spine.spine02 -- leaf.siteB.leaf03
%%kroki d2

title: |md
  # My **network** topology
| {near: top-center}
explanation: |md
  # Clos
  - 2 spines
  - 3 leaves
| {near: center-right}

spine.spine01 -- leaf.siteA.leaf01
spine.spine01 -- leaf.siteA.leaf02
spine.spine01 -- leaf.siteB.leaf03
spine.spine02 -- leaf.siteA.leaf01
spine.spine02 -- leaf.siteA.leaf02
spine.spine02 -- leaf.siteB.leaf03
D2 supports basic animations that can enhance the presentation of diagrams and help draw the viewer's attention to specific areas, especially during updates or transitions. While not essential for static network topologies, animations can be useful for illustrating changes or making interactive diagrams more engaging.
%%kroki d2

spine.spine01.style.animated: true

spine.spine01 -- leaf.siteA.leaf01
spine.spine01 -- leaf.siteA.leaf02
spine.spine01 -- leaf.siteB.leaf03
spine.spine02 -- leaf.siteA.leaf01
spine.spine02 -- leaf.siteA.leaf02
spine.spine02 -- leaf.siteB.leaf03: {
  style.animated: true
}
Adding connection information, such as interface names, to diagrams can be challenging, especially for auto-layout algorithms. D2 allows you to style arrowheads and assign labels to both the source and target ends of a connection.
%%kroki d2

spine.spine01 -- leaf.siteA.leaf01: {
  source-arrowhead.label: 0/1
  target-arrowhead.label: 0/1
}
spine.spine01 -- leaf.siteA.leaf02: {
  source-arrowhead.label: 0/2
  target-arrowhead.label: 0/1
}
spine.spine01 -- leaf.siteB.leaf03: {
  source-arrowhead.label: 0/3
  target-arrowhead.label: 0/1
}
spine.spine02 -- leaf.siteA.leaf01: {
  source-arrowhead.label: 0/1
  target-arrowhead.label: 0/2
}
spine.spine02 -- leaf.siteA.leaf02: {
  source-arrowhead.label: 0/2
  target-arrowhead.label: 0/2
}
spine.spine02 -- leaf.siteB.leaf03: {
  source-arrowhead.label: 0/2
  target-arrowhead.label: 0/3
}
The direction of the diagram can have an impact on how appealing and readable it is. Choosing the right layout direction can significantly improve clarity.
%%kroki d2

direction: left

spine.spine01 -- leaf.siteA.leaf01
spine.spine01 -- leaf.siteA.leaf02
spine.spine01 -- leaf.siteB.leaf03
spine.spine02 -- leaf.siteA.leaf01
spine.spine02 -- leaf.siteA.leaf02
spine.spine02 -- leaf.siteB.leaf03
D2 supports multiple layout engines that control how elements are positioned in the diagram. Choosing the right engine can significantly improve readability, especially for larger or more complex topologies.
The default engine is Dagre, which is also used by Mermaid and GraphViz. It is well-suited for hierarchical layouts. ELK tends to produce fewer edge crossings and generates clean, orthogonal routes, making it a strong option for complex network diagrams.
%%kroki d2

vars: {
  d2-config: {
    layout-engine: elk # dagre
  }
}
direction: left

spine.spine01 -- leaf.siteA.leaf01
spine.spine01 -- leaf.siteA.leaf02
spine.spine01 -- leaf.siteB.leaf03
spine.spine02 -- leaf.siteA.leaf01
spine.spine02 -- leaf.siteA.leaf02
spine.spine02 -- leaf.siteB.leaf03
By combining the features discussed, a simple 2-spine, 3-leaf topology might look like the example below. Feel free to experiment and improve the diagram; I'd be interested to see what you come up with.
%%kroki d2

vars: {
  d2-config: {
    layout-engine: elk # dagre
  }
}
  classes: {
    switch_green: {
      shape: image
      icon: https://svg.infrastructureascode.ch/square/green/sq_switch.svg
    }
    switch_red: {
      shape: image
      icon: https://svg.infrastructureascode.ch/square/red/sq_switch.svg
    }
    active_link: {
      style.animated: True
    }
  }

  spine.spine01: {
    class: switch_green
    link: http://localhost/spine01
    tooltip: interfaces\nLo 0\nEth1
  }
  spine.spine02: {
    class: switch_green
    link: http://localhost/spine02
    tooltip: interfaces\nLo 0\nEth1
  }
  leaf.leaf01: {
    class: switch_green
    link: http://localhost/leaf01
    tooltip: interfaces\nLo 0\nEth1
  }
  leaf.leaf02: {
    class: switch_red
    link: http://localhost/leaf02
    tooltip: interfaces\nLo 0\nEth1
  }
  leaf.leaf03: {
    class: switch_green
    link: http://localhost/leaf03
    tooltip: interfaces\nLo 0\nEth1
  }


direction: left

spine.spine01 -- leaf.leaf01: {
  source-arrowhead.label: 0/1
  target-arrowhead.label: 0/1
  class: active_link
}
spine.spine01 -- leaf.leaf02: {
  source-arrowhead.label: 0/2
  target-arrowhead.label: 0/1
}
spine.spine01 -- leaf.leaf03: {
  source-arrowhead.label: 0/3
  target-arrowhead.label: 0/1
  class: active_link
}
spine.spine02 -- leaf.leaf01: {
  source-arrowhead.label: 0/1
  target-arrowhead.label: 0/2
  class: active_link
}
spine.spine02 -- leaf.leaf02: {
  source-arrowhead.label: 0/2
  target-arrowhead.label: 0/2
}
spine.spine02 -- leaf.leaf03: {
  source-arrowhead.label: 0/2
  target-arrowhead.label: 0/3
  class: active_link
}
The Kroki API is straightforward to use. You can send a diagram as a POST request to the endpoint, and the response will be returned in the format specified in the URL. Alternatively, you can encode the diagram and use a GET request. This approach makes it easy to share diagrams via URL, but it only works well for medium-sized diagrams due to URL length limitations.
Example Python code for encoding diagrams is available in the documentation.
import requests

d2_syntax = """
explanation: |python
  print("Thanks for reading")
|
"""

try:
    response = requests.post("https://kroki.io/d2/svg/", data=d2_syntax)
    response.raise_for_status()
except requests.HTTPError as exc:
    ...
from IPython.display import SVG, display
display(SVG(response.content))